The Total Sales Report gives you deep visibility into your menu performance. It shows what’s selling well, how profitable each item is, and how much each dish costs you to make. With this report, you can make confident, data-driven decisions for your venue.
🔍 What you’ll see in the report
- Top-selling items based on real POS data
- Profitability per dish using your FoodByUs recipes
- Food cost percentages so you know your margins
- Sales trends in real time
✅ How to get started
Follow these steps to unlock your Total Sales Report:
Step 1: Connect your POS
Go to Account Settings > Integrations > POS Integration and connect your system. We currently support:
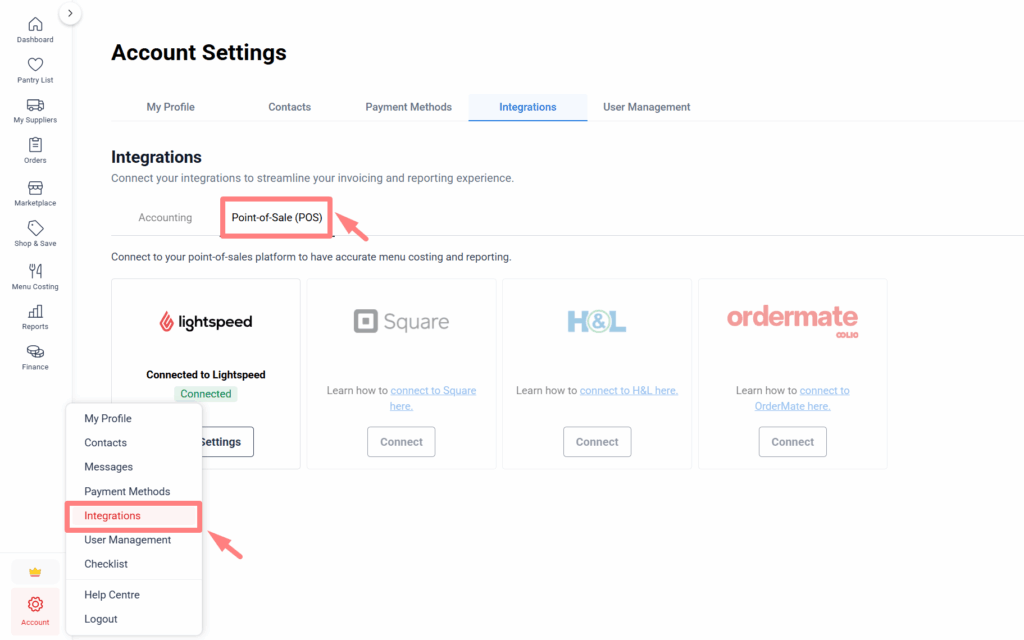
As soon as you’re connected, we will pull your catalogue as well as the last 3 months of sales data automatically. We will continue to sync your sales data once a day.
🔌 Don’t see your POS listed? Contact us to request an integration!
Step 2: Map POS items to your recipes
Once connected, head to the POS Settings tool to link each menu item from your POS with its corresponding FoodByUs recipe. This lets us match sales data with food costs. Note: this is available on desktop only.
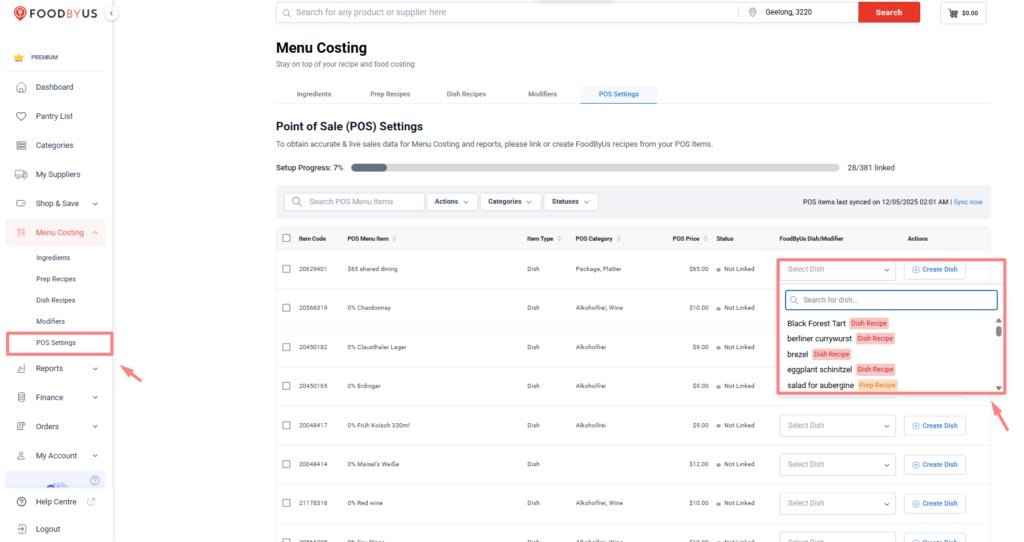
Step 3: No recipes yet? Use ‘Create Dish’
If you haven’t created any recipes in FoodByUs yet, no problem. In the POS Settings tool, click ‘Create Dish’ next to any POS item to automatically generate a recipe shell using:
- The dish name
- Category
- Sell price (from your POS)
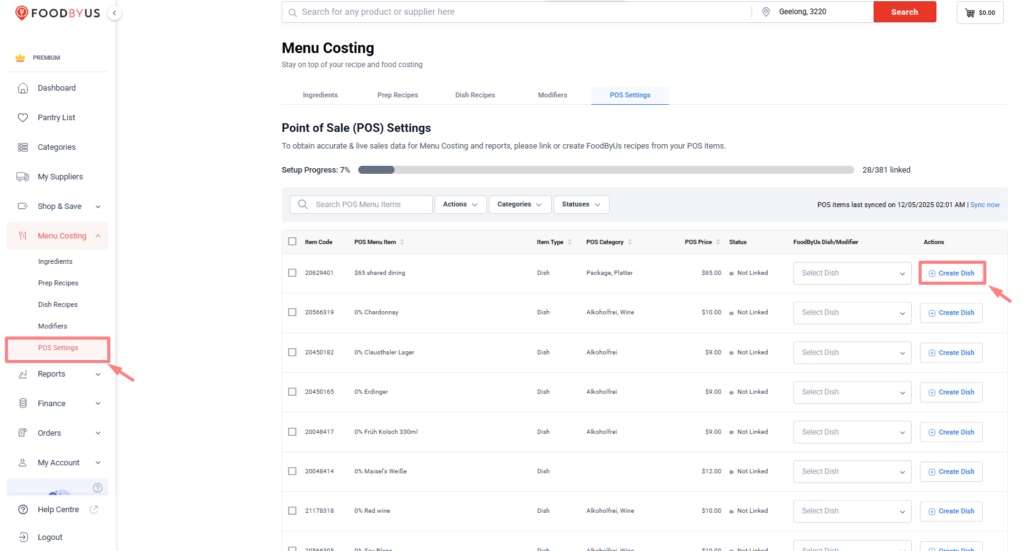
Then simply add the ingredients and quantities to complete the recipe. This is how we calculate accurate food costs and profitability.
Step 4: View your report
Go to Reports > Total Sales to explore your live data. You’ll now see sales volume, cost %, gross profit, and more.
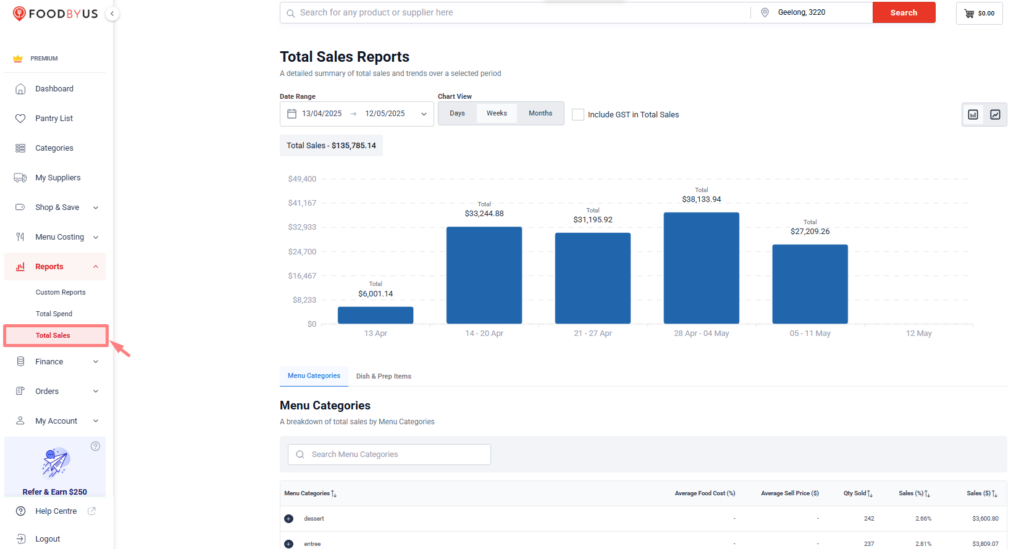
🧠 Why Use This Report?
- Spot your most and least profitable dishes
- Understand true food cost % for every item
- Identify opportunities to adjust recipes or pricing
- Back decisions with real performance data