The Reports section of your dashboard shows a summary of your monthly & weekly total spend. Use these reporting tools to keep on top of your weekly/monthly spend, stock demands & core/regular products.
To view your Total Spend & Purchases By Category
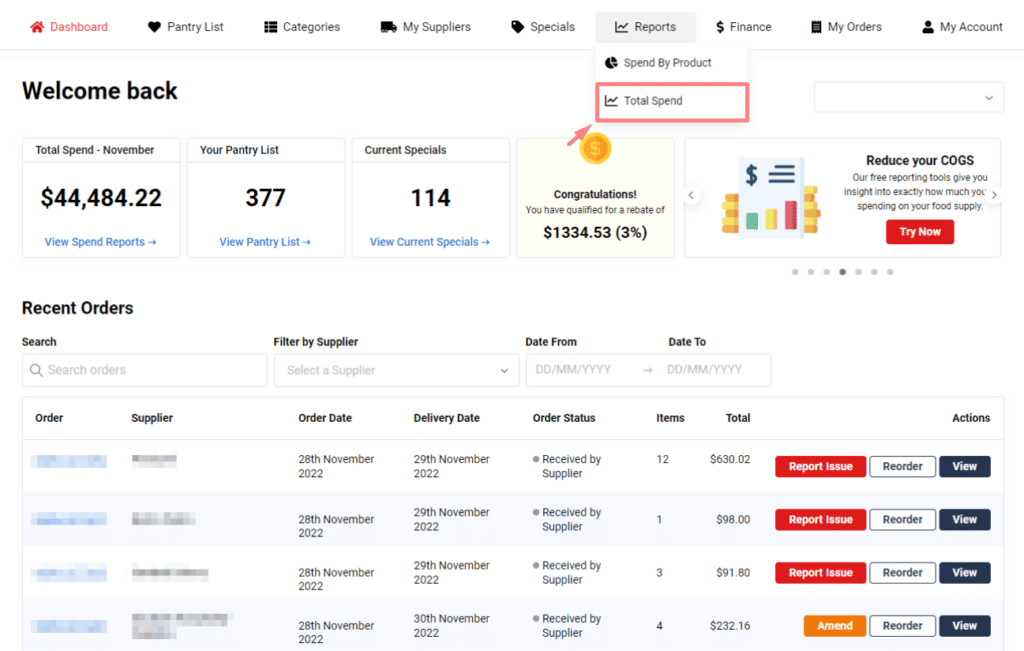
Step 1:
In the top bar menu, go to Reports > Total Spend
Step 2:
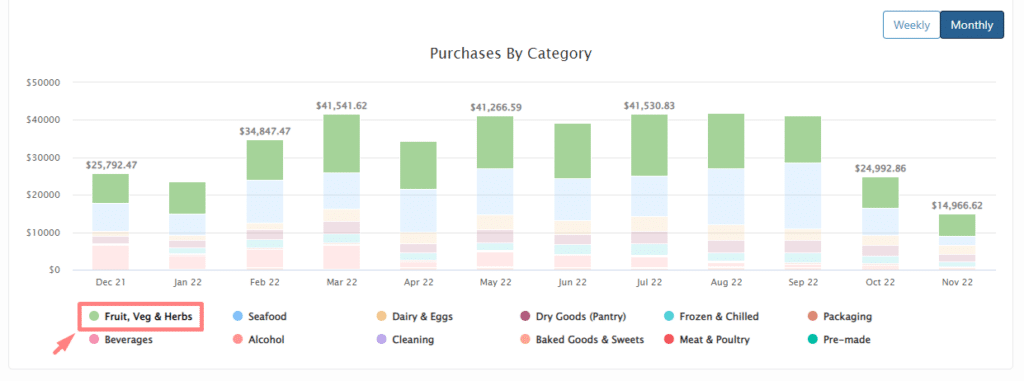
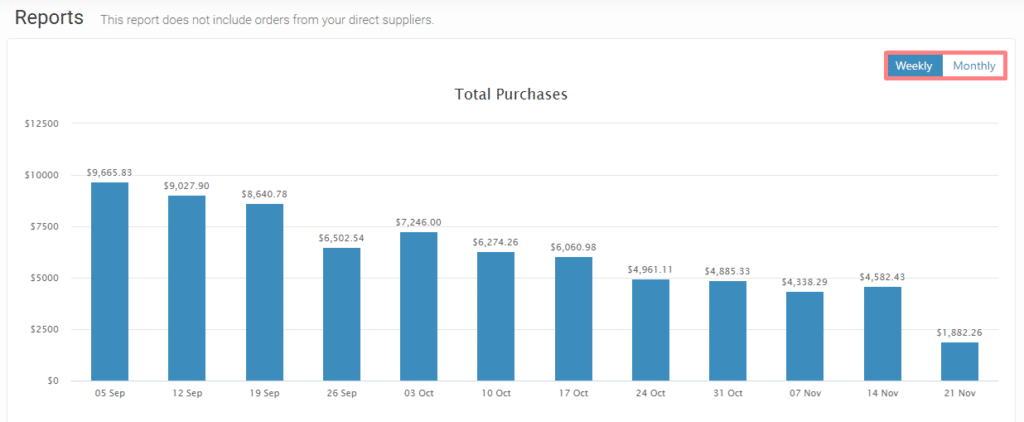
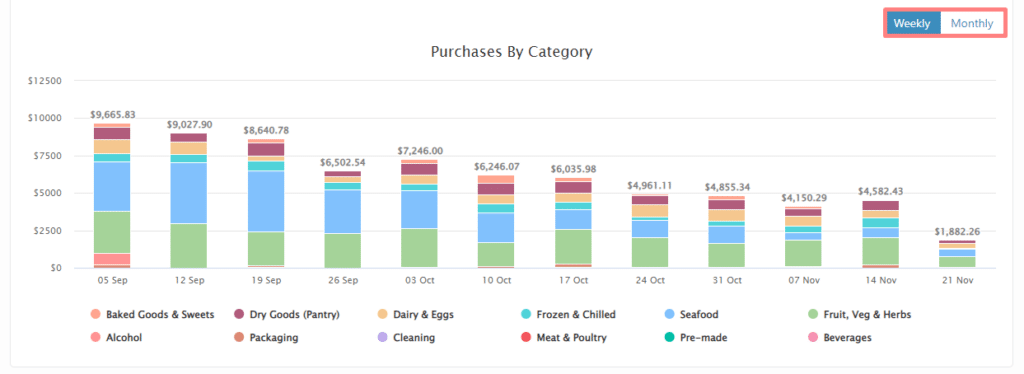
You can choose to view your weekly or monthly spend for both Total Purchases & Purchases By Category.
Step 3:
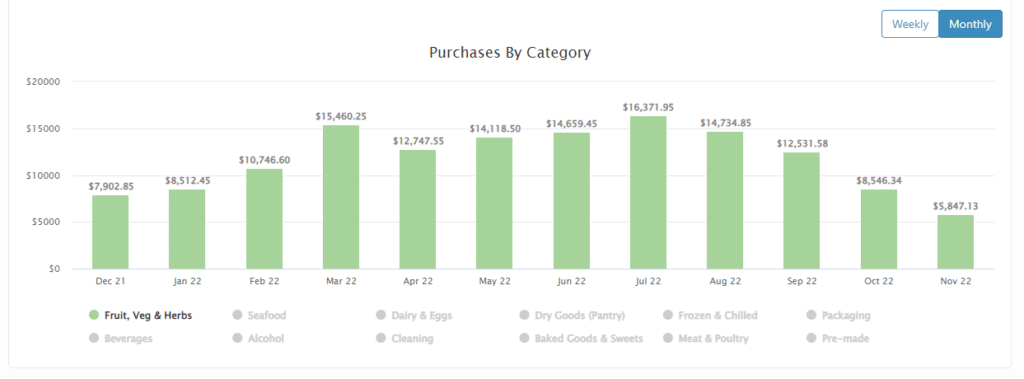
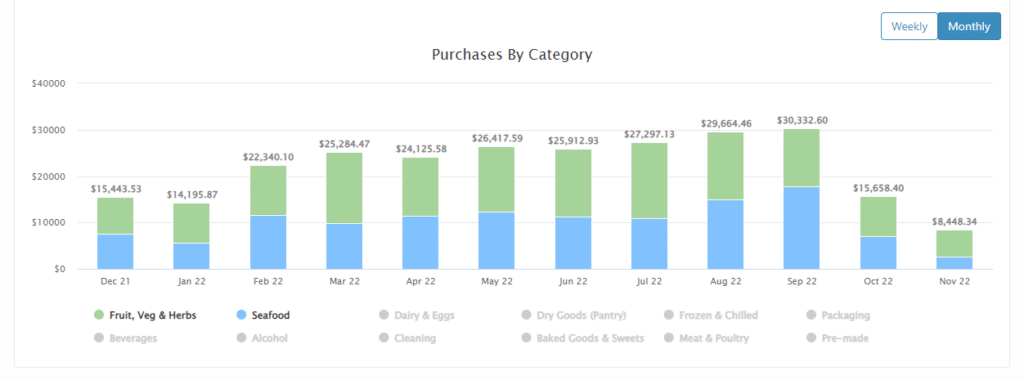
You can view & compare your spend for specific categories by clicking on one or more categories.