Our Custom Report tool gives you a clear overview of your product costs, giving you better insights into spending patterns. Understanding and managing your cost of goods is crucial for running a successful kitchen. Create unique Reports using Filters to optimise your spend for menu costing, set margins, track supplier price changes, analyse seasonal trends and much more!

- Understand Your Spend (Spend Overview)
- Use Filters to Create Custom Reports
- Ways to Use Filters to Optimise Your Purchases
1. Understand your spend (Spend Overview)
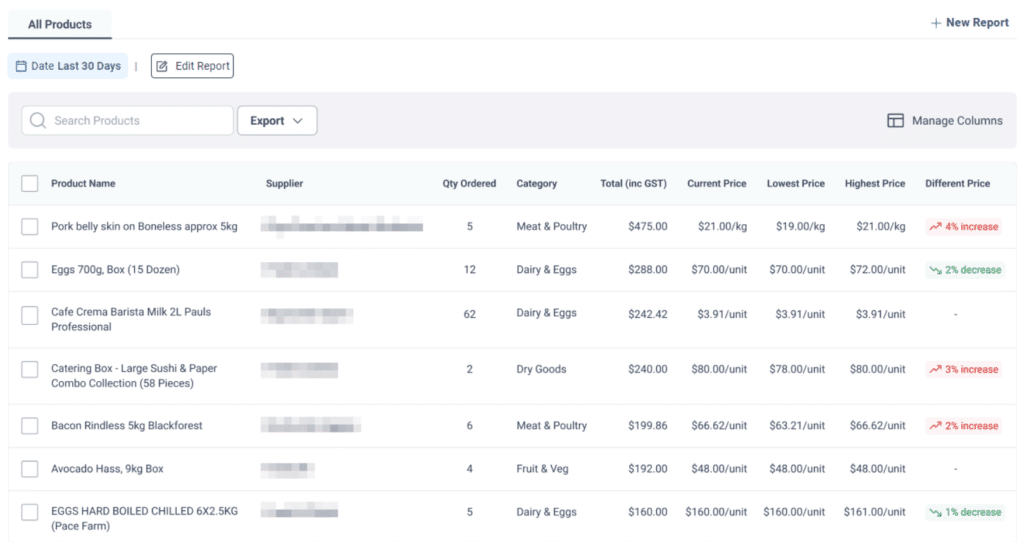
The default view for your report will present your orders for the last 30 days. You will see the current price, lowest price and highest price of all your products purchased over this given period. A price difference icon will be shown if a product has increased or decreased in price.
2. Use Filters to Create Custom Reports
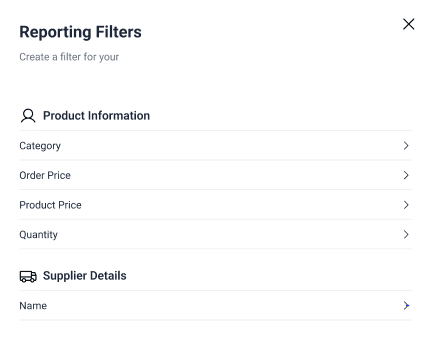
Reporting Filters allows you to generate Custom Reports based on Product Information or Supplier Details. There are a variety of options to choose from, and indefinite ways to use these Filters to suit your needs. We’ll run through one example of how to use Reporting Filters in the case below.
Case: Filtering for products from Supplier X in the Meat & Poultry and Fruit & Veg categories with over 5% price increase
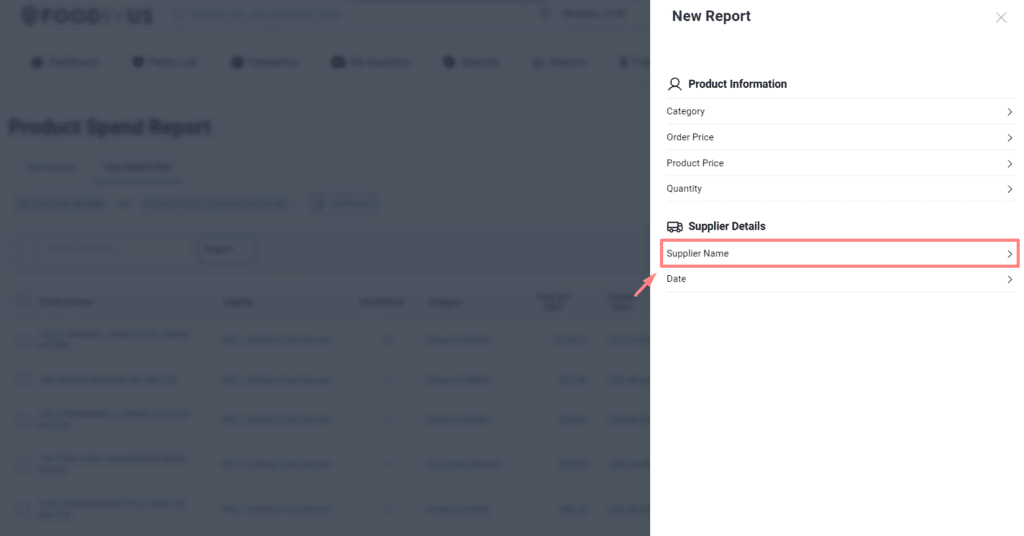
1. First, we’ll need to filter for all products from Supplier X. Click ‘New Filter’ and select ‘Supplier Name’ under Supplier Details.
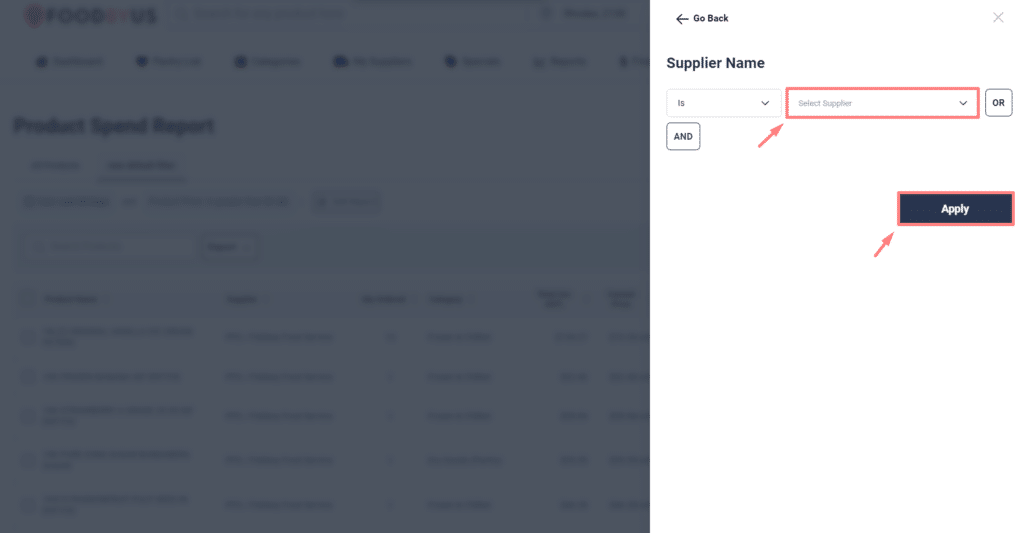
2. Next, select ‘is’ and search for Supplier X. Then click ‘Apply’.
3. Now, we want to add another filter. Select ‘Add Another Filter’ and add Meat & Poultry and Fruit & Veg under Categories.
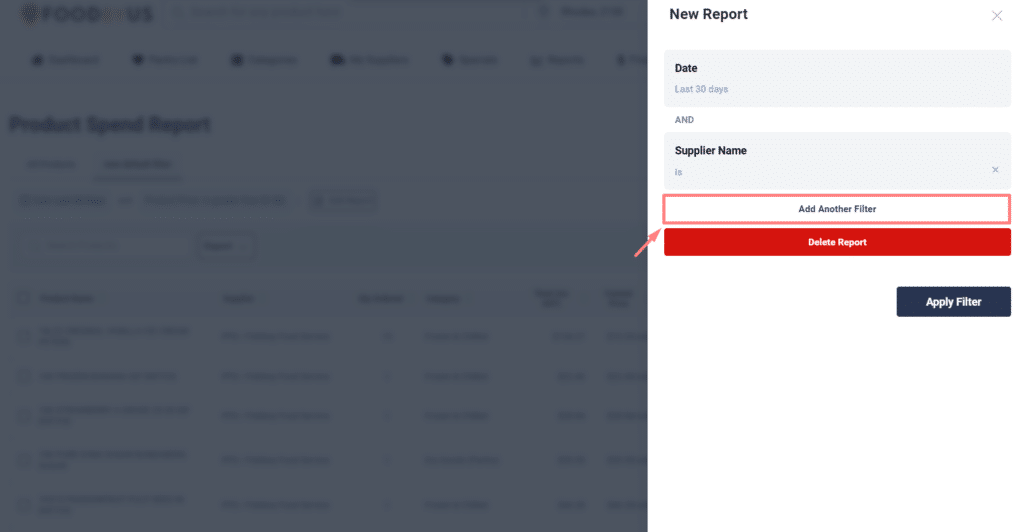
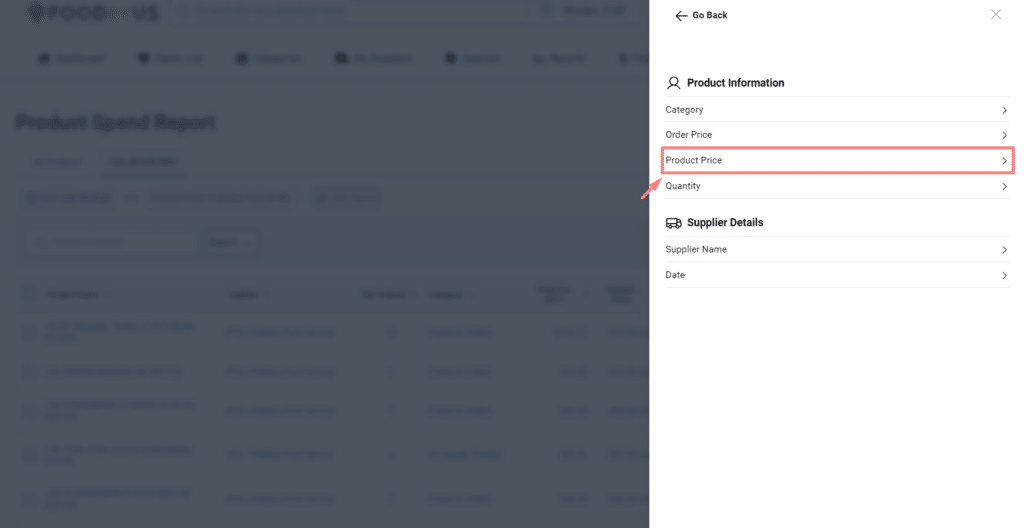
4. To search for products which have increased by 5% or more, select ‘Product Price’.
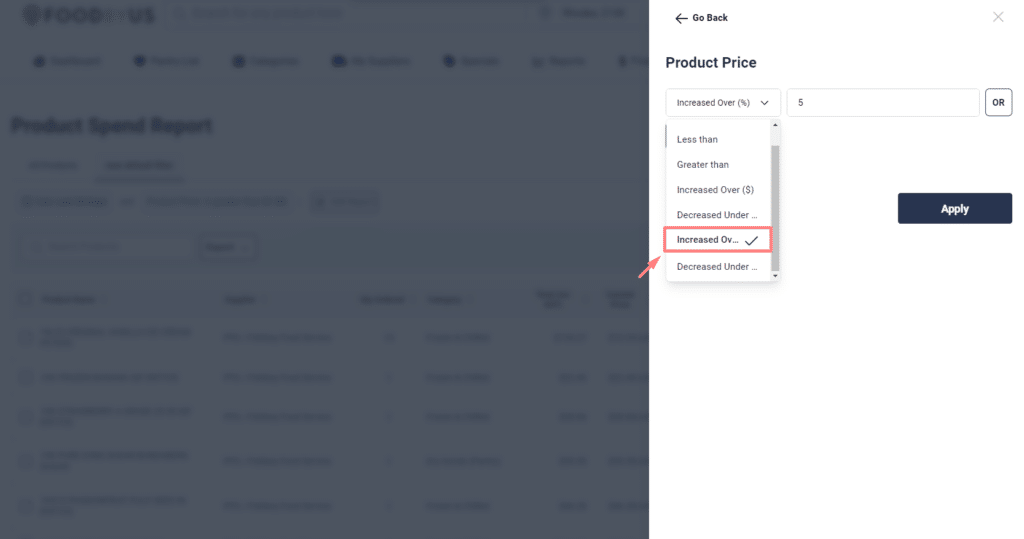
5. In the dropdown, select ‘Increased over (%)’ and enter value 5.
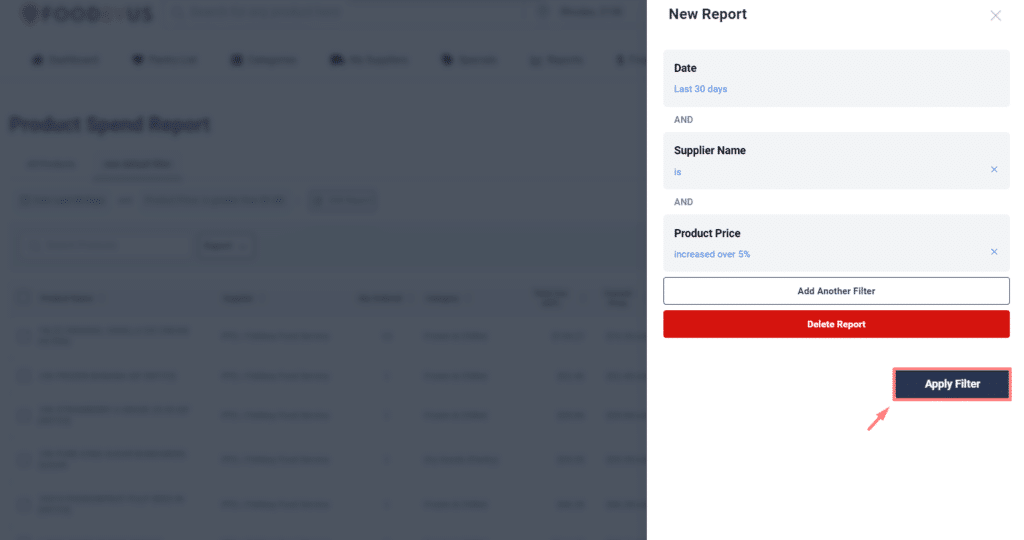
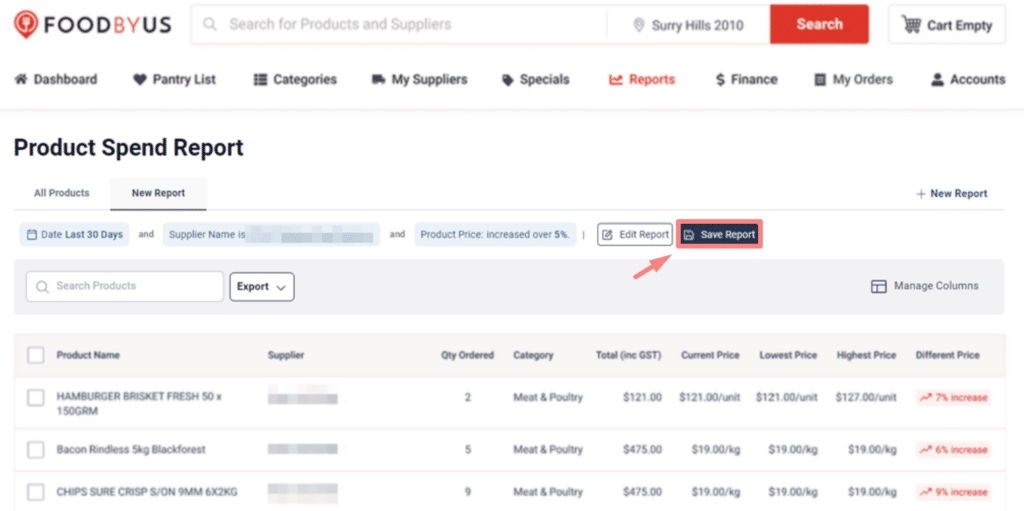
6. Your Report Filters should look like below. Hit ‘Apply Filter’ to create your Custom Report.
7. Save your Custom Report by clicking ‘Save Report’
3. Ways to Use Custom Reports to Optimise Your Purchases
There are countless ways to use Filters and Custom Reports for your unique business needs. Here are some popular ways our customers use our Reporting Tool to gain deeper insights into their spending patterns to reduce their COGS.
1. Menu Costing: Rotating menus requires chefs to revisit their costs more frequently to stay on top of their COGS. Use Custom Reports to check if specific products have fluctuated in price and compare those prices to set margins. This allows you to find more affordable alternatives or redesign your menus to increase profitability.
2. High & Low Price Analysis: Gain insights into the highest and lowest prices for any ingredients you have ordered. This feature helps you identify opportunities to optimise your purchasing strategy and save costs.
3. Seasonal Trends: Leverage the tool to identify seasonal ingredient trends. Plan your menus and purchases accordingly to capitalise on cost savings during certain times of the year.
4. Supplier Performance Metrics: Evaluate the performance of your suppliers by analysing how their pricing compares to the market average. Make informed decisions about which suppliers provide the best value for your money.